

How many employees can IBM sustain? At Dec. 31, 2013, IBM reported 431,212 employees for the company and wholly-owned subsidiaries. In February 2014, there were projections that 13,000 to 15,000 employees would be released within the year. The estimate for 2015 of 26% further reductions calculates to leave about 300,000 IBMers worldwide. This leads to three questions about the current situation (and potential other cases with similar circumstances).
- 1. How many employees, worldwide, can a company sustainably afford?
- 2. Where should global resources be geographically deployed?
- 3. Can science guide us on sustainable ranges of scale for organizations?
The domain of business is a social science, so corporate decisions lead to paths where alternatives (i.e. the path not taken) can never be tested in reality. Thus, much of the thinking below is speculative.
1. How many employees, worldwide, can a company sustainably afford?
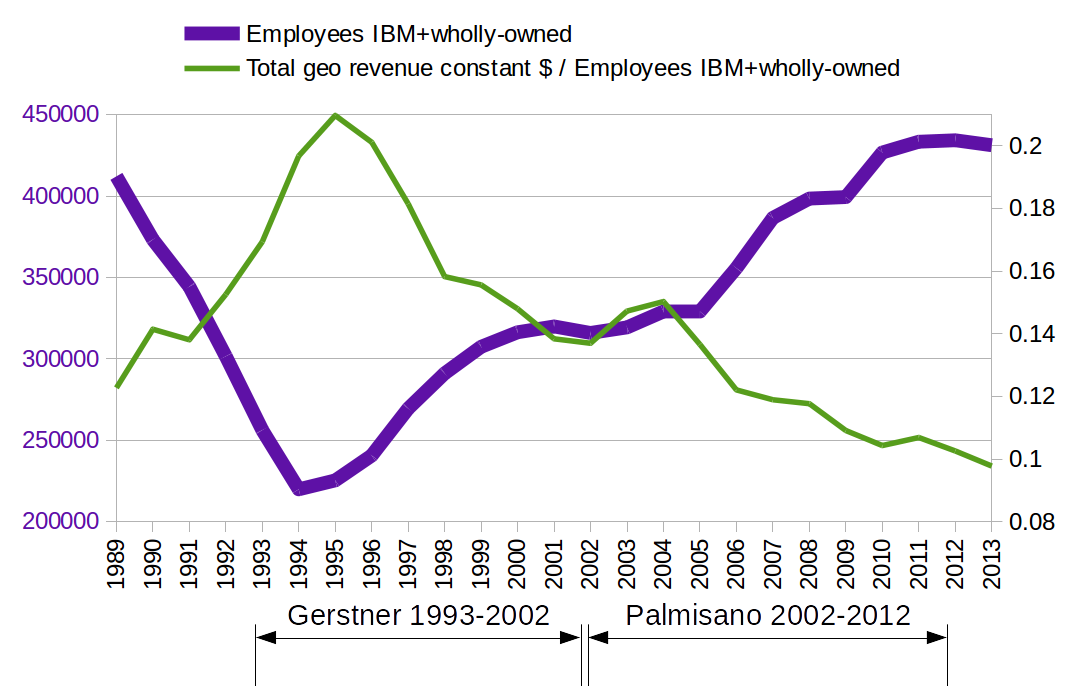
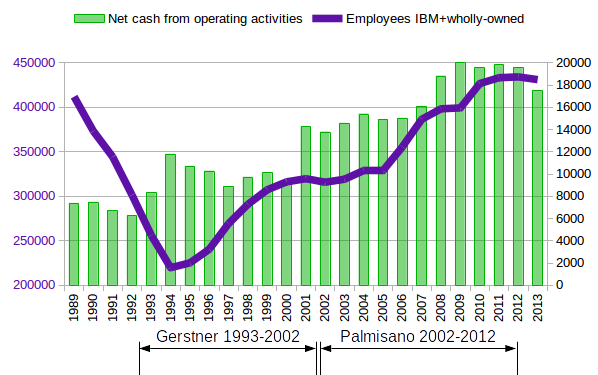
Let’s look at history, published in annual reports. IBM reported 412,113 employees at Dec. 31, 1989. Under John Akers as CEO, the organization was trimmed down to 301,542 employees by the end of 1992. Lou Gerstner joined as CEO in April 1993, and job actions were announced by July.
The employees to be cut, mostly from overseas operations, will be given incentives to leave, but just what the financial package will be has not been determined. The $8.9 billion charge includes funds to pay for 25,000 additional job cuts under an early retirement program announced this year that has drawn 50,000 participants — twice as many as expected — and for 35,000 job cuts over the next 18 months. [….]
Of the $8.9 billion pretax charge for streamlining I.B.M., $2 billion is to pay for the additional 25,000 workers who took advantage of the company’s early-retirement program that began in 1993. Some $4 billion will go to pay for the 35,000 workers who will be trimmed over the next year to 18 months. The remaining $2.9 billion will go to retire surplus factories, equipment and office buildings [Lohr, 1993].
At the end of 1994, IBM reported a population of 219,839 employees. With a successful recovery by March 2002 for the handover from Gerstner to Palmisano, IBM reported that its employee population had grown to 319,876.

So what happens if revenues don’t increase over time? Cash outflows exceed cash inflows … with an extreme situation that a company could go bankrupt. Bankruptcies don’t happen because of lack of profitability. Bankruptcies happen when a company becomes illiquid.
With 433,362 employees at the end of 2011, the company gained $19.586 billion in net cash flow in 2012. With 432,246 employees at the end of 2012, the company gained $17.485 billion in new cash flow in 2013, less than the preceding year. The official detailed cash flow for 2014 won’t be reported until the 2015 annual meeting (traditionally towards the end of April), but the 4Q2014 report on January 20 estimated total revenues down 12% for the year.
| Year | Employees |
| 1965 | 172,445 |
| 1970 | 269,291 |
| 1975 | 288,647 |
| 1980 | 341,279 |
| 1985 | 405,535 |
| 1990 | 373,816 |
| 1995 | 225,347 |
| 2000 | 316,303 |
| 2005 | 329,373 |
| 2010 | 426,751 |
It doesn’t take long for financial markets to recognize a liquidity problem. As a signal of confidence in the company, the stock price of IBM at Dec. 31 was $94.13 in 1989, $113.00 in 1990 and $89.00 in 1991 … plunging to $50.38 in 1992. Today, IBM seems to maintain a good cash flow, and has been able to fund stock repurchases.
So, how many employees can IBM sustainably afford? The 1994 low of 219,839 employees is a level previously seen in the late 1960s period of the System/360, a few years before the System/370 was released. That bottom level seems rather lean for a company that needs to continuously develop and release new products and services globally. A target of 300,000 employees would be at the level in the late 1990s. Intuiting from the graphs, IBM was in the 300,000 to 325,000 employee range successfully in the first half of the 2000s decade. When the number of employees grew past 350,000 in the second half of the 2000s decade, the revenue-per-person-productivity didn’t keep up. The choices are either to replace the lowest productivity employees with better ones, or to retrain and reassign current personnel. There’s unfortunately a time lag to developing human capital. Onboarding professional hires has an associated lag of up to a year to reach for a person to attain his or her promise of productivity. A fresh hires from a university might take 3 to 5 years to mature. In the opposite direction, reducing employee levels introduces shocks to a system that can be equally disruptive.
2. Where should global resources be geographically deployed?
IBM reports revenue by three geographic regions: Americas; Europe, Middle East and Africa; and Asia Pacific. It does not, however, report where its employees are located. In some respects, as a globally integrated enterprise, it can move work around. However, it is clear that the historical record of revenue from U.S. sources has not grown at the rate of emerging and developing markets.
| Yr.-to-Yr. Percent Change | Yr.-to-Yr. Percent Change Adjusted for Currency |
|||||
| Year | Major markets |
Growth markets |
BRIC countries |
Major markets |
Growth markets |
BRIC countries |
| 2006 | + | + | 9.9% | + | + | 5.0% |
| 2007 | + | + | 26.3% | + | + | 18.0% |
| 2008 | 5.1% | 9.8% | 17.6% | 2.0% | 10.0% | 15.0% |
| 2009 | (8.2)% | (3.5)% | 0.7% | (6.4)% | 1.2% | 4.3% |
| 2010 | 1.1% | 16.0% | 22.8% | 1.0% | 10.9% | 18.4% |
| 2011 | 5.1% | 16.0% | 18.6% | 1.6% | 11.4% | 16.1% |
| 2012 | (3.5)% | 4.2% | 7.4% | (1.3)% | 6.9% | 12.2% |
| 2013 | (4.2)% | (4.9)% | (8.2)% | (2.2)% | (2.4)% | (5.6)% |
The IBM Annual Report does not provide absolute dollar financials by country, but, since 2006, has reported on percentage growth rates in BRIC (Brazil, Russia, India and China) countries. In 2007, the Growth Markets organization (of which the BRIC countries are a part) was created, and headquartered in Shanghai. Since the growth markets start from a smaller base, their early percentage growth is unsurprisingly higher than that in major markets. In the 2013 annual report, however, IBM’s performance in growth markets and BRIC countries was poor, relative to major markets.
In 2012, having retired from IBM, Sam Palmisano founded the Center for Global Enterprise, that “strives to advance awareness among private and public sector leaders of the worldwide benefits that can result in the 21st century from corporate best practices and economic success”. In 2014, Palmisano published Re-Think: A Path to the Future, including some statistics on the significance of the rise of emerging and and developing economies:
Consider a few data points that illustrate the expanding role of emerging markets in the global economy:
- In 2013, the total gross domestic product of emerging and developing economies was slated by the IMF to be $44.4 trillion. Among the developed economies, the comparable figure was $42.8 trillion.xxiii This was the first time in recorded history that the combined GDP of developed economies had been exceeded by the combined GDP of emerging and developing economies.xxiv
xxiii“For the first time, the combined GDP of poor nations is greater than the rich ones,” Quartz, August 28, 2013.
http://qz.com/119081
xxiv“O for a beaker full of the warm South,” The Economist, January 17, 2013. http://www.economist.com/news/finance-and-economics/21569747-poor-countries-other-poor-countries-matter-more-rich-ones-o-beaker- In 2012, companies invested more in emerging markets than they did in the United States, Europe, and Japan – an unprecedented development.xxv
xxv“World Investment Report 2013: Overview,” UNCTAD, June 2013. http://unctad.org/en/PublicationsLibrary/wir2013overview_en.pdf
- In 2011, the United States accounted for just 8.3 of the world’s exports (down from 21.7 percent in 1948). The U.S. decline has largely represented a shift to Asia, which accounted for 14 percent of global merchandise exports in 1948, but today accounts for more than 31 percent.xxvi (Europe’s share has fluctuated during this period – rising from 35 percent in 1948 to nearly 51 percent in 1973, but today settling at 37 percent.)
xxvi“International Trade Statistics 2012,” World Trade Organization.
http://www.wto.org/english/res_e/statis_e/its2012_e/its12_world_trade_dev_e.pdf- In 2011, emerging markets accounted for 32 percent of world trade – up from 16 percent in 1991. And for the first time, developing countries exported more to each other than to advanced economies. Emerging markets are also home to many world-class companies that compete with companies headquartered in developed markets, from JBS in Brazil (the largest animal protein processor in the world) to Lenovo in China (the world’s largest provider of PCs) to PKN Orlen in Poland (a refiner of crude oil). Each of these is a member of the Fortune Global 500 – a list that has become infused with companies from emerging markets.xxvii
xxvii“Fortune Global 500,” Fortune, 2013.
http://money.cnn.com/magazines/fortune/global500/2013/full_list/?iid=G500_sp_full [Palmisano 2014, 16-17]
How does a company operate in an environment such as this? IBM has appreciated operating as a multinational corporation since the founding of the World Trade organization in 1949. Beyond ethnocentric and polycentric designs, geocentric organizations involve “a collaborative effort between subsidiaries and headquarters to establish universal standards and permissive local variations, to make key allocational decisions on new products, new plants, new laboratories” [Perlmutter 1969, 13].
Jacques Maisonrouge, the French-born president of IBM World Trade [from 1967, and member of the IBM board of directors in 1983], understands the geocentric concept and its benefits. He wrote recently:
“The first step to a geocentric organization is when a corporation, faced with the choice of whether to grow and expand or decline, realizes the need to mobilize its resources on a world scale. It will sooner or later have to face the issue that the home country does not have a monopoly of either men or ideas …”
“I strongly believe that the future belongs to geocentric companies …. What is of fundamental importance is the attitude of the company’s top management. If it is dedicated to ‘geocentrism’, good international management will be possible. If not, the best men of different nations will soon understand that they do not belong to the ‘race des seigneurs’ and will leave the business” [Perlmutter 1969, 16–17].
In 2006, Sam Palmisano resurfaced similar ideas as the Globally Integrated Enterprise, beyond the multinational corporation.
The shift from multinational corporation to globally integrated enterprise has assumed two distinct forms. The first has involved changes in where companies produce things; the second, changes in who produces them. Until recently, companies generally chose to produce goods close to where they sold them. As a consequence, most foreign investments targeted specific foreign markets. Today, overseas investments continue to be made with a view to gaining access to important sources of foreign demand, but companies are investing more to change the way they supply the entire global market. The global integration of production cuts costs and taps new sources of skills and knowledge [Palmisano, 2006].
These ideas are more fully fleshed out in the publication of the Re-Think book in 2014.
In this model, work is organized in fundamentally different ways. It calls for different skills and behaviors, more collaboration, greater focus on a multiplicity of cultural differences, and less hierarchy.
As an example, decisions about where to locate operations are based on how to maximize value for customers, employees, and business partners. In the succinct observation of one of my former colleagues, Michael Cannon-Brookes, IBM’s vice president of global strategy for growth markets, “Instead of taking people to where the work is, you take work to where the people are.” v Thus rather than maintaining separate supply chains in different markets, there is one supply chain, and it’s global, not just for products, but also services, capital, ideas, and intellectual property.
v“Organizing for an emerging world,” McKinsey Quarterly, June 2012. http://www.mckinsey.com/insights/organization/organizing_for_an_emerging_world
Similarly, human capital is thought of not in terms of countries and regions and business units, but rather how to manage and deploy it as one global asset. And the GIE is nimble – possessing the ability to quickly enter new markets and seize new business opportunities wherever they arise.
In short, the GIE operates seamlessly as a single organic entity by integrating internal operations horizontally and globally, collaborating with external partners, and operating at the best location in the world, to maximize value creation from a global point of view. [Palmisano 2014, pp. 3-4]
In IBM, the 2006 rellocation of procurement from Somers, New York, to Shenzhen, China, was based on already having 1,850 procurement and logistics professionals in the region. This led to the way for other departments to move out of Armonk, such as data center delivery to India, and intellectual property to the Netherlands [Palmisano, 2014, p. 43]. Back office finance operations moved to Brazil. Centers of Excellence were established, for telecommunications, water management, and rail innovation, serving clients are the world. “As an example, for IBM Japan human resources began to be carried out in Manila, accounts receivable in Shanghai, accounting in Kuala Lumpur, procurement in Shenzhen, and customer service in Brisbane. lxix [Palmisano 2014, p. x]
lxix“An interview with Michael Cannon-Brookes,” McKinsey, 2012. http://www.mckinsey.com/~/media/McKinsey/dotcom/client_service/Organization/PDFs/Interview_with_Michael_
Cannon_Brookes.ashx
With this global approach to resourcing, one would need detailed knowledge about IBM’s internal organization to figure out which centers have located in which locales. For each employee whose function is being moved to a center of excellence somewhere else globally, retraining or learning new skills for local and regional teams may involve changes in profession or career direction.
3. Can science guide us on sustainable ranges of scale for organizations?
Let’s suppose that an organization like IBM — designed as a Globally Integrated Enterprise, where communications can be as practically instantaneous down the street as around the world — could function well at around 300,000 employees. Is there research that could help us to figure out if such a number is really worth targeting?
On one side, we have research on superlinear scaling. Based on power laws, there could be increasing returns to innovation. Sublinear scaling has been documented for decades in biology. Superlinear scaling is currently an area of research in urbanization.
Many diverse properties of cities from patent production and personal income to electrical cable length are shown to be power law functions of population size with scaling exponents, β, that fall into distinct universality classes. Quantities reflecting wealth creation and innovation have β ≈1.2 > 1 (increasing returns), whereas those accounting for infrastructure display β ≈0.8 < 1 (economies of scale). We predict that the pace of social life in the city increases with population size, in quantitative agreement with data, and we discuss how cities are similar to, and differ from, biological organisms, for which β < 1. Finally, we explore possible consequences of these scaling relations by deriving growth equations, which quantify the dramatic difference between growth fueled by innovation versus that driven by economies of scale. This difference suggests that, as population grows, major innovation cycles must be generated at a continually accelerating rate to sustain growth and avoid stagnation or collapse [Bettencourt, Lobo, Helbing, Kühnert, and West, 2007].
In studies of cities, there are both positives and negatives: “larger cities are disproportionally the centers of innovation, wealth and crime, all to approximately the same degree” [Bettencourt, Lobo, Strumsky, and West, 2010]. For a company such as IBM, perhaps a larger scale permits opportunities for innovation, but also carries vigilance to ensure against deceleration which could rapidly lead to collapse.
On another side, we have social networks and brokerage. Social networks seem limited by the magic number 150, from Robin Dunbar.
… the number 150 starts to emerge from all kinds of unexpected places once you know what to look for. It is the average village size recorded in William the Conqueror’s Domesday Book of England in 1087, and it is the average size of the smallest standalone unit (the company) in all modern armies. In business organisations, it turns out to be the point at which businesses start to need formal management structures if they are not to fall apart as they grow in size. Intriguingly, it is also the typical size of communities among both the Hutterites and the Amish, both of which practise a communalistic form of fundamentalist Christianity in the USA. In sum, the number 150 seems to define the limit on the number of people with whom you can form personalised relationships that involve a sense of mutual obligation, trust and reciprocity [Dunbar 2010].
Relationship across local social networks can be bridged by brokers. However, the value of brokers is in direct ties, not secondhand ties.
Direct brokerage involves a person moving information from one group to another, relying on his or her own contacts in the groups. Previous research has documented various returns to direct brokerage, including good ideas, more positive job evaluations, higher compensation, and faster promotion. Secondhand brokerage refers to moving information between groups to which the broker is only indirectly connected through other brokers. Judging from the results …, performance in all three populations is more associated with direct than indirect brokerage …. More striking is the complete irrelevance of indirect contacts …. [Burt 2007, p. 140]
A Globally Integrated Enterprise rationalizes functions across the world, potentially creating stronger local networks, at the risk of overloading brokers within the large world network. The effective balance between local networks and brokers, extended through electronic mediation, could be challenged by weaknesses in some regions or pursuits, and over-resourcing in others.
Managing organizations is an art. We can be reminded of history at IBM. The year 2015 exhibits some aspects reminiscent of 1993. As we look forward, we can only speculate what alternatively might have happened at IBM if other decision on headcount were made.
References
Bettencourt, Luís M. A., José Lobo, Dirk Helbing, Christian Kühnert, and Geoffrey B. West. 2007. “Growth, Innovation, Scaling, and the Pace of Life in Cities.” Proceedings of the National Academy of Sciences 104 (17): 7301–6. doi:10.1073/pnas.0610172104.
Bettencourt, Luís M. A., José Lobo, Deborah Strumsky, and Geoffrey B. West. 2010. “Urban Scaling and Its Deviations: Revealing the Structure of Wealth, Innovation and Crime across Cities.” PLoS ONE 5 (11): e13541. doi:10.1371/journal.pone.0013541.
Burt, Ronald S. 2007. “Secondhand Brokerage: Evidence on the Importance of Local Structure for Managers, Bankers, and Analysts.” Academy of Management Journal 50 (1): 119–48.
Bort, Julie. 2014. “IBM Employees Fear Company Will Begin Up To 13,000 Layoffs Tomorrow.” Business Insider. February 25. http://www.businessinsider.com/ibm-layoffs-expected-2014-2.
Cringely, Robert X. 2015. “IBM’s Reorg-from-Hell Launches next Week.” I, Cringely. January 22. http://www.cringely.com/2015/01/22/ibms-reorg-hell-launches-next-week/.
Dunbar, Robin I. M. 2010. “The Magic Number.” RSA Fellowship Digital Journal. April. http://www.thersa.org/fellowship/journal/archive/spring-2010/features/the-magic-number.
IBM. 2013. Annual Report 2013. G507-0501-18. http://www.ibm.com/annualreport/.
Lipsky, Jessica. 2014. “IBM Begins US Layoffs.” EETimes. February 27. http://www.eetimes.com/document.asp?doc_id=1321227.
Lohr, Steve. 1993. “I.B.M. Chief Making Drastic New Cuts; 35,000 Job To Go.” The New York Times, July 28. http://query.nytimes.com/gst/fullpage.html?res=980CEEDF163EF93BA15754C0A965958260.
Palmisano, Samuel J. 2006. “The Globally Integrated Enterprise.” Foreign Affairs, May. http://www.foreignaffairs.com/articles/61713/samuel-j-palmisano/the-globally-integrated-enterprise.
Palmisano, Samuel J. 2014. Re-Think: A Path to the Future. Center for Global Enterprise. http://thecge.net/about/book/.
Perlmutter, Howard V. 1969. “The Tortuous Evolution of the Multinational Corporation.” Columbia Journal of World Business 10 (1): 9–18.