
For the Quantitative Methodologies for Design Research (定量研究方法) course for Ph.D. students at Tongji University in spring 2017, Susu Nousala invited me to join the team of instructors in collaborative education in Shanghai. Experts were brought in during the course to guide the graduate students.
My participation in the course over two days had three parts: (a) preparing a lecture outline; (b) orienting the students; and (c) equipping the students with tools.
(A) Preparing a lecture outline
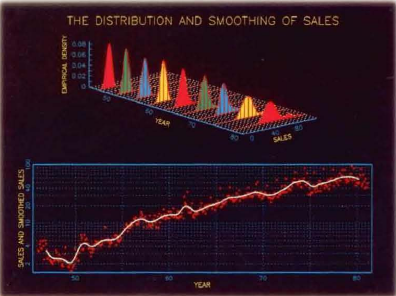
While I’m comfortable with the mathematics underlying statistical analysis, I have a lot of practical experience of working with business executives who aren’t. Thus, my approach to working with data relies a lot on presentation graphics to defog the phenomena. While the label of data science began to rise circa 2012, I’ve had the benefit of practical experience that predates that.
In my first professional assignment in IBM Canada in 1985, data science would have been called econometrics. My work included forecasting country sales, based on price-performance indexes (from the mainframe, midrange and personal computer product divisions) and economic outlooks from Statistics Canada. Two years before the Macintosh II would bring color to personal computing, I was an early adopter of GRAFSTAT: “An APL system for interactive scientific-engineering graphics and data analysis” developed at IBM Research. This would eventually become an IBM program product by called AGSS (A Graphical Statistical System) by 1994.

In 1988, I had an assignment where data science would have been called marketing science. I was sent to California to work in the IBM partnership with Metaphor Computer Systems. This was a Xerox PARC spin-off with a vision that predated the first web page on the World Wide Web by a few years. These activities led me into the TIMS Marketing Science Conference in 1990, cofounding the Canadian Centre for Marketing Information Technologies (C2MIT) and contributing chapters to The Marketing Information Revolution published in 1994.
This journey led me to appreciate the selection and use of computer-based tools for quantitative analysis. Today, the two leading platforms in “Data Science 101” are Python (a general purpose language with statistical libraries), and the R Project for Statistical Computing (a specialized package for data analysis and visualization). Both are open source projects, and free to download and use on personal computers. I tried both. R is a higher level programming language more similar to the APL programming language that gets work done more quickly. For statistical work, I recommend R over Python (although APL is a theoretically better implementation).
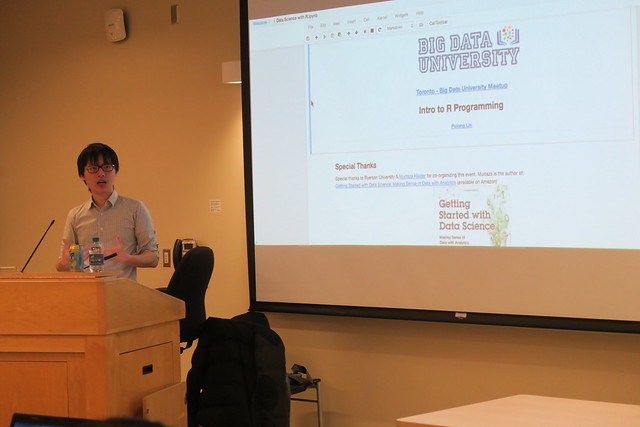
Since I live in Toronto, I attended the February session of Data Science with R – Bootcamp in person, at Ryerson University. There, I was watched Polong Lin leading a class through R using the Jupyter notebook, both in (i) an interactive version, and (ii) a printable version. Students had the choice to either follow Polong (i) actively, in a step-by-step execution in the Cognitive Class Virtual Lab (formerly called the Data Scientist Workbench) with a cloud-based R session through their web browsers, or (ii) passively, reading the static printable content.
Polong was helpful in guiding us with course resources that would be available in Shanghai. In North America, we have cognitiveclass.ai with course materials, and datascientistworkbench.com as a cloud computing platform (that includes R and Python). For China, there are parallel sites at bigdatauniversity.com.cn and datascientistworkbench.cn in Chinese, that native speakers could be more comfortable using.
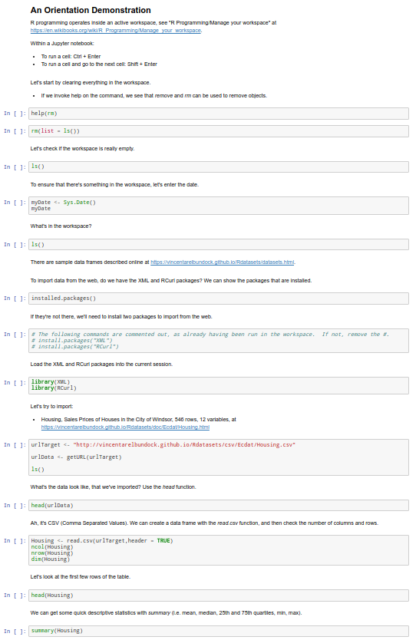
Based on Polong’s materials, I developed a Jupyter notebook additionally emphasizing graphical presentation for an in-person lecture in Shanghai. These materials are cached at coevolving.com/tongji/201704_DataScienceR/, where they are accessible globally.
(B) Orienting the students
Ph.D. students in design will not have been required to have studied mathematics at the university level. However, I then recalled that Shanghai high school students had a history with PISA achievement of “top of the global class in maths with an average score … or the equivalent of nearly three years of schooling, above the average” in 2013.
This strength flavoured the description of my approach for the lecture to students:
- Did you study linear algebra? (Pause to have a Chinese professor translate that.)
- Of course, you studied linear algebra in high school.
- So, how do I approach exploratory data analysis?
- I plot the data, and draw a straight line through it.
- If the plot doesn’t look right, I move the data so that straight line looks right.
The workshop scope was then explained as:
- NOT to teach you everything about data science!
- You should know about ways to represent data to support your research findings.
- You will see some good tools for qualitative methods (and maybe even quantitative methods).
- We can work together to get you started on tools that will suit your needs.
Working with the end in mind, the orientation stepped through a recommended package with three tools: (i) ggplot2, through (ii) Jupyter, on (iii) R.
The demonstration loaded an example of Housing, with Sales Prices of Houses in the City of Windsor as 546 rows and 12 variables. This showed that a higher housing price correlates with a larger lot size, something that makes sense intuitively. The ggplot2 library has a nice feature of facet grids, so that incorporating the number of bedrooms into an analysis can be visualized as a collection of plots (rather than a single plot).
(C) Equipping the students with tools
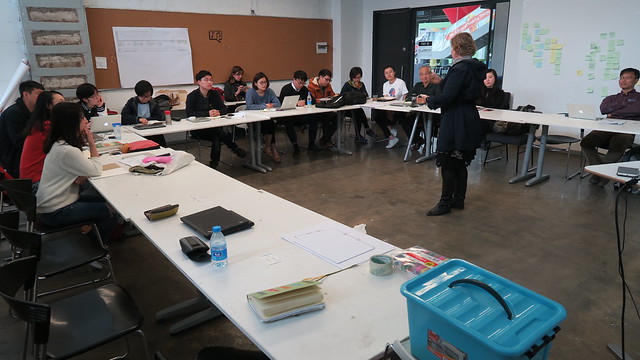
Having then shown the students what outputs could look like, we released them to experiment as a self-study group, with the professors available as standby resources. As Ph.D. students at one of the top universities in China, they were expected to step up to the challenge. Since neither Susu nor I are proficient in Mandarin, the students would likely learn faster as a group if not slowed down by second-language conversion.
The students then enthusiastically set upon getting their tools to work. They collectively surfaced two challenges: (i) technical; and (ii) research use.
(i) The technical issue was that, although the bigdatauniversity.com.cn web site was readily accessible, the students found the cloud-based datascientistworkbench.cn slow over the Internet. While we in North America expect high bandwidth speeds in our workplaces and homes, the responsiveness through the browser interface at Tongji University to the cloud platform was too slow. This led the students to prefer installing open source software tools onto their personal computers, dissolving Internet connectivity problems.
Most of the students were running MacBooks, and a few were on Windows laptops. Downloading R from the Comprehensive R Archive Network and installing that program was easy. Downloading Anaconda from Continuum Analytics as a step towards a Jupyter notebook was relatively straightforward. But then, with both Anaconda and R up and running, getting Jupyter to connect to R was a challenge. This required opening up a Terminal — a new experience for most on MacOS, but somewhat more familiar as command line on Windows — and typing in magic incantations.
- The installation of IRKernel is not a drag-and-drop activity, and sometimes requires more technical knowledge to interpret the messages signalling other than success.
- MacOS X with Jupyter needs some Python libraries that requires the installation of XCode.
- MacOS X after 10.5 (Leopard) no longer includes X11, requiring a separate installation of XQuartz.
- On MacOS X, installing the IRKernel would not work if R was launched by clicking on the R icon, but would if R was started from a Terminal.
Resolving these issues had the Ph.D. students collectively helping each other for 6 hours in the afternoon and evening on the first course day, and then 2 hours on the second morning. Updating MacOS X with XCode over the Internet was slow on the university network. On Windows, one student easily got all of the packages working on his computer, and then struggled to help a friend struggling with similar hardware and software.
The ordeal of installing software had an unexpected benefit of becoming a team-building activity. The students banded together in mutual support!
(ii) The research use issue arose as the students worked their way through the Big Data University exercises. Exercises typically use datasets already prepackaged for use, so students can focus on the programming language. Real research projects requiring bringing in real datasets. Pointing out the import features for R programming moved the students one step ahead.
In a course oriented towards a future of big data, this raised the question: where is the data? The phenomenon of open data — as electronic data sources readily accessible over the Internet — is nascent within the People’s Republic of China. This led to questions about research design, where students would have to determine questions of interest, and plan ways to collect data.
After those two days, my participation in the course diminished with a few exchanges over WeChat. Susu brought some of the students onto a research project in Southern China, putting their research design learning into practice over the summer. By the fall, the students should have performed preliminary data analysis, so that coaching may be welcomed on finer points about statistics.


